Description:
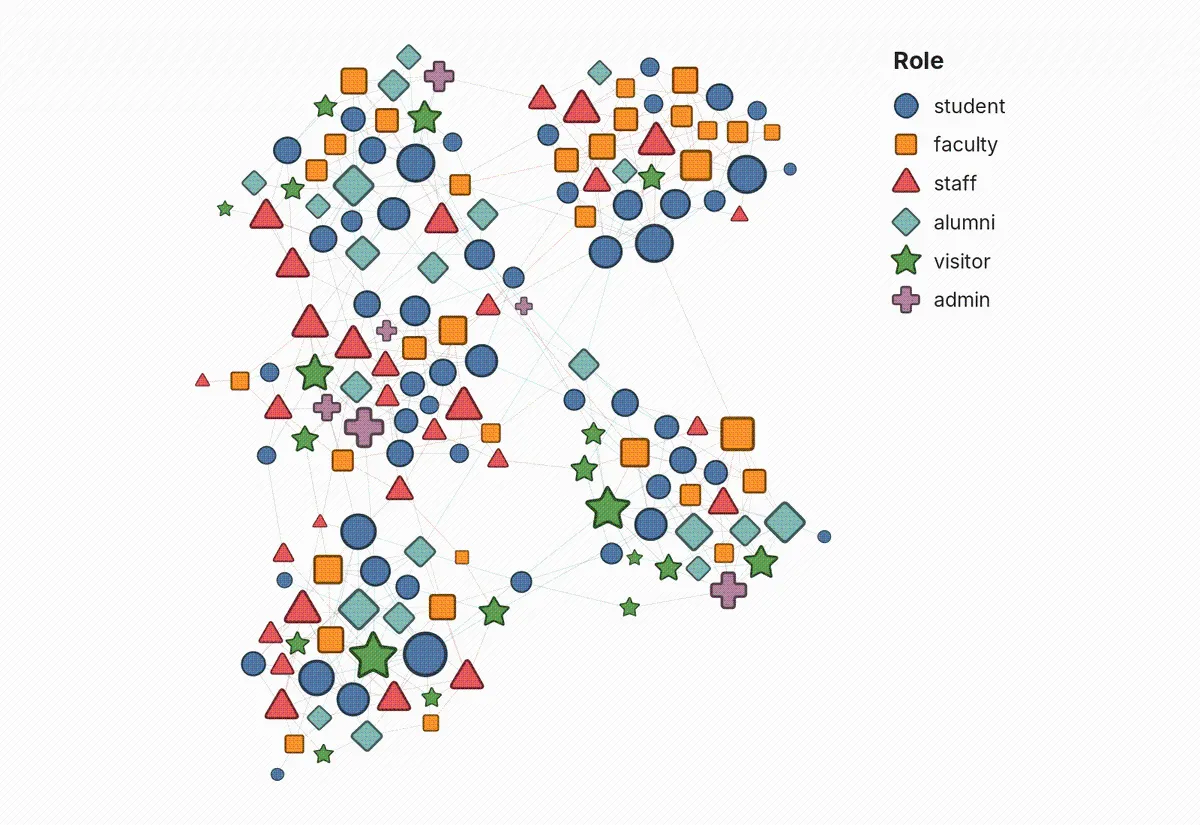
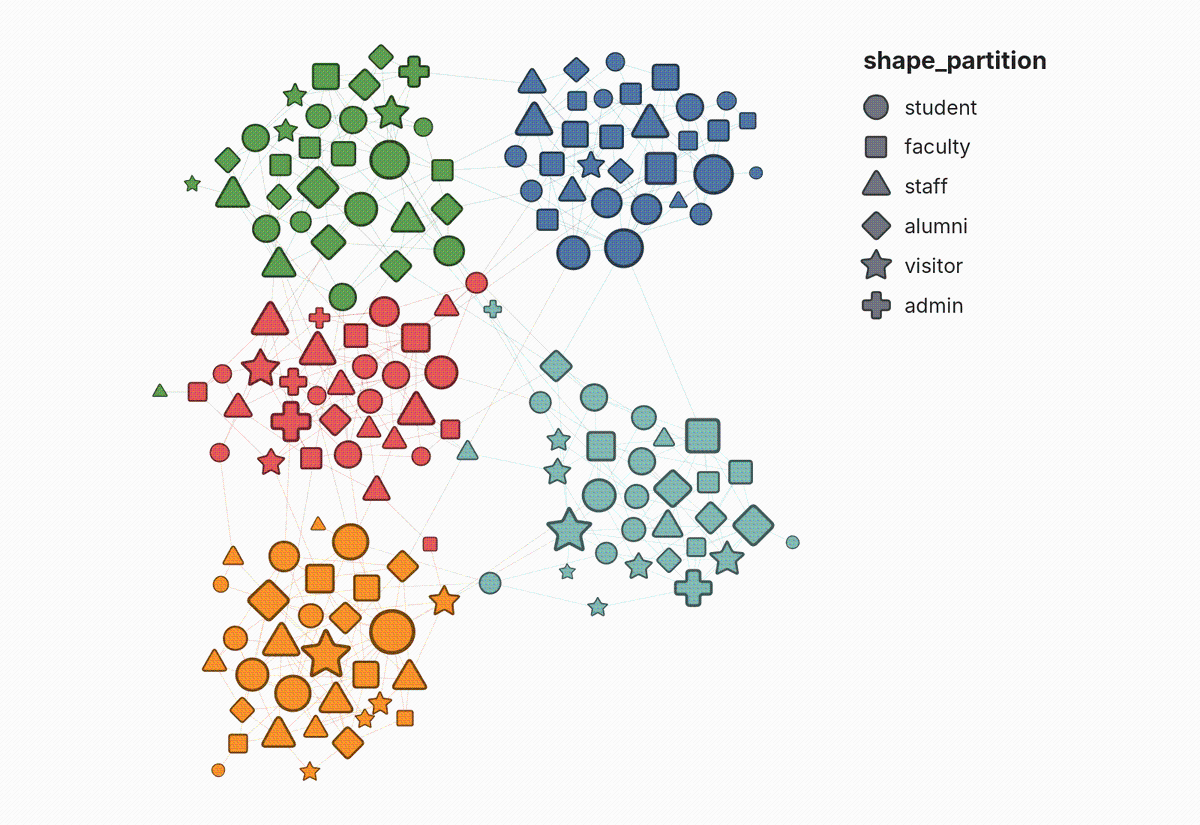
Categories are ordered by node count, largest first, which is the same order the Appearance panel uses when it assigns colors to a partition. Coloring and shaping by the same column therefore agree.
Nodes with no value in the column are drawn as circles, and color, size, border, and opacity are left to the default renderer.
Shape is worth spending when colour and position cannot carry the variable: on an attribute that cuts across the clusters rather than naming them, and that does not already track node size. It is also the encoding that survives greyscale printing and colourblind readers, where a colour palette collapses.
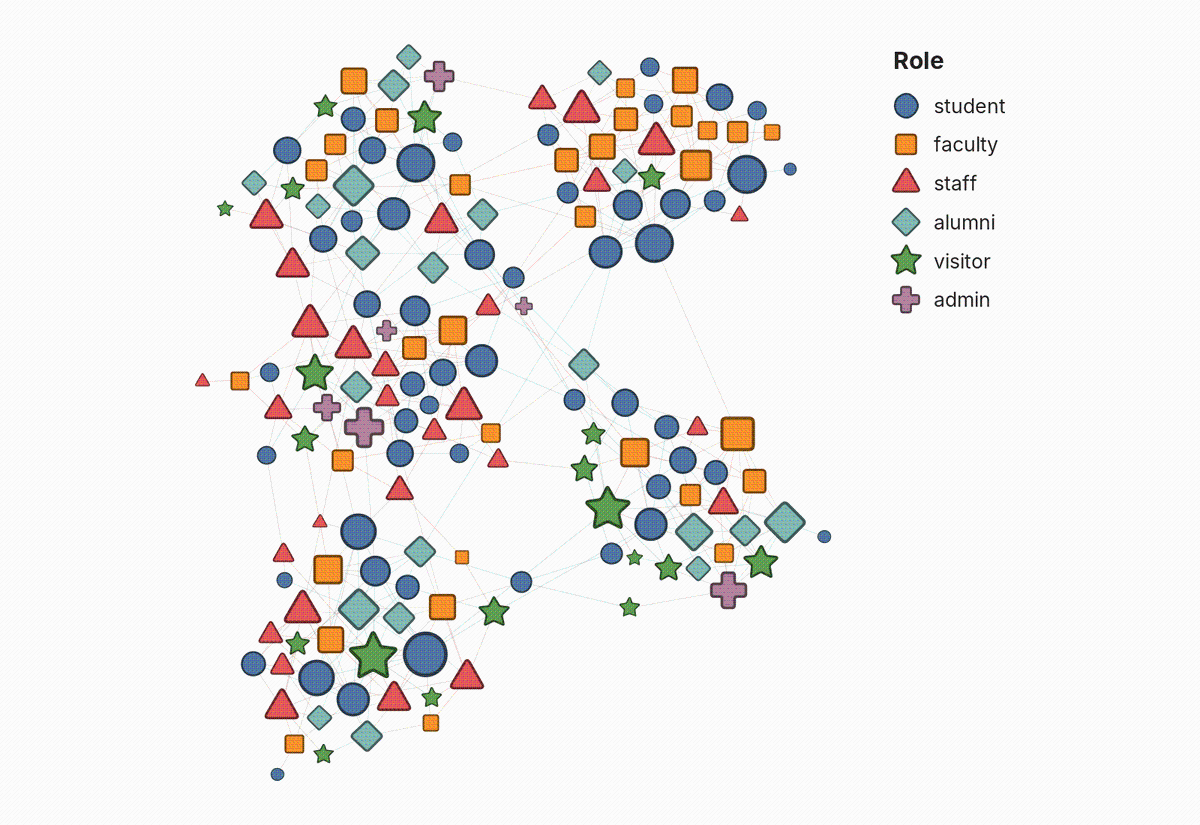
A legend beside the graph says which shape stands for which category, in the preview and in exports. Name the column the node colours encode in "Colour legend column" and the legend explains colour as well, when that column matches the colours exactly.
Shapes appear in Preview and its PNG, SVG and PDF exports. The Overview window keeps drawing circles, because it is drawn by a separate engine this plugin does not extend.
If you also use Polygon Shaped Nodes or another plugin that draws nodes or arrows, choose which one draws them in Preview > Manage Renderers.
Edges and arrowheads meet each shape's outline, not the circle Gephi assumes, so arrows stay visible and point at the shape.
The renderer replaces the built-in node renderer on install, so there is nothing to enable. Set "Shape partition column" in the Preview settings under Nodes, then refresh. Leaving it empty reads a column named shape_partition instead, so a dataset that carries that column is shaped on import with nothing to configure.
Author:
Sources:
github.com/gephi/gephi-plugins/tree/master-forge/modules/ShapeByPartitionLicense:
Compatible Gephi versions:
Tools > Pluginsmenu. The following download links may be useful to spread this plugin to people with no internet access, for instance.
Related images:

README:
Shape by Partition
Assign node shape automatically from a categorical attribute, the shape equivalent of color by partition.
Gephi can already map a partition onto node color. It cannot map one onto node shape, because a node has no shape property: shape only exists at render time. This plugin adds a Preview renderer that reads a categorical node column and draws each node as the shape assigned to its category.
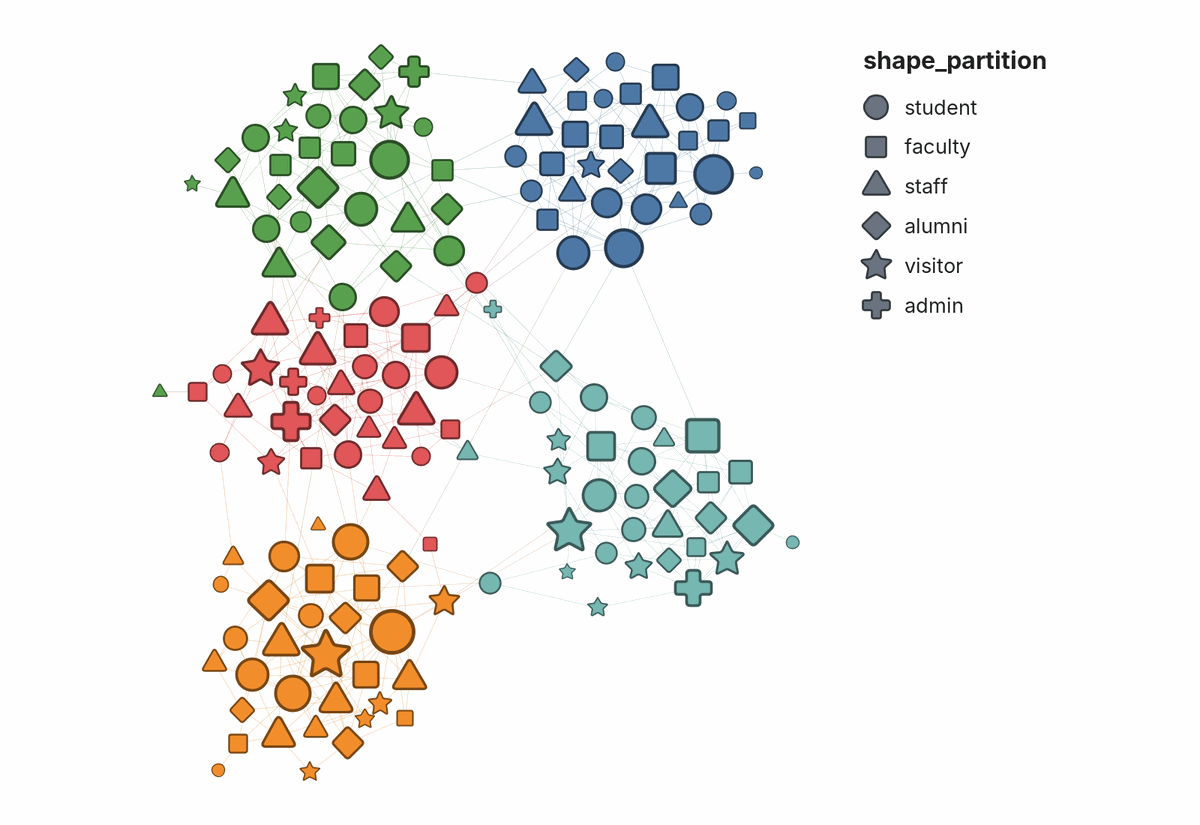
What it covers
| Shapes? | |
|---|---|
| Preview tab | Yes |
| PNG, SVG, and PDF exports | Yes, with a legend |
| Overview (the main graph window) | No. Nodes there stay circles. |
| Appearance panel | No. Shapes are set in Preview, from a column. |
Saved .gephi projects and GEXF files |
The column is saved, so the shapes come back when the file is reopened. GEXF's own viz:shape field is not written or read. |
Circles in Overview are not a bug. Overview is drawn by a separate OpenGL engine that this plugin does not extend, and Gephi has no shape property on nodes that Overview could read, so the shapes exist only where Preview draws the graph. Overview is for exploring; the figure you publish comes from Preview, and that is where the shapes are.
Using it
- Open the Preview tab.
- Under Nodes, set Shape partition column to the name of the node column holding the categories.
- Refresh.
A legend appears beside the graph, saying which shape stands for which category. Turn it off with Shape legend, or give it a heading with Shape legend title (left empty, it uses the column's title). Both are under Nodes.
When colour encodes a different column from shape, name that column in Colour legend column and the legend adds its colours below the shapes. One key then explains both, for example shape for discipline and colour for project group. Colour legend title gives that section a heading (left empty, it uses the column's title).
Or set nothing: with the column field empty the renderer reads a node column
named shape_partition. A file that ships that column is shaped on import with
nothing to configure, and any tool that can write a node attribute can drive
the plugin without touching Preview properties at all. A name that is given
and does not resolve is never quietly replaced by the convention, because a map
that looks right and means something else is worse than circles.
Other plugins that draw nodes or arrows
If you also use Polygon Shaped Nodes, or any other plugin that draws nodes or arrows, only one of them can be on at a time. Choose which in Preview > Manage Renderers. If shapes do not appear after installing this plugin, check there first.
This plugin replaces two of Gephi's built-in Preview renderers and adds one:
| Renderer | What it does | Replaces |
|---|---|---|
| Shape by Partition | Draws each node as its category's shape | Gephi's node renderer |
| Arrows (Shape by Partition) | Ends edges and arrowheads on each shape's outline | Gephi's arrow renderer |
| Shape legend (Shape by Partition) | Draws the key beside the graph | Nothing; it is new |
Replacing is what makes it work with nothing to enable: when a plugin renderer extends a built-in one, Gephi drops the built-in, so the two never draw the same node twice. Without the arrow renderer, an arrowhead stops short of a triangle's base or disappears under a star's point, and the edge's direction is lost. Edges to circular nodes are drawn exactly as before.
When two installed plugins replace the same built-in renderer, Gephi turns on only the one with the lowest service position and leaves the other off. This plugin registers its node renderer at 310 and its arrow renderer at 210.
When shape is worth spending
Shape is a low-capacity channel. Spend it only where it buys something colour and position cannot, or it is decoration that costs legibility. Four questions, in order:
- Does the layout already show this? If the attribute is the community structure, the layout has drawn it and colour has reinforced it. A third encoding of the same variable adds nothing.
- Is it independent of degree? If the categories differ systematically in degree, node size already separates them and shape is redundant again. This is the trap that is easiest to miss, because it looks like a success: the categories are visually distinct, just not because of their shape.
- Is colour already spent? Shape earns its place when colour is carrying a different variable, so the map holds two facts instead of one.
- Does anyone need to locate these categories in the structure? Shape is good at "where do the X sit relative to the clusters", which is a homophily or contamination question. It is poor at comparing quantities.
The strongest case is the one that survives all four: an attribute that is categorical, spatially mixed, degree-independent, and analytically wanted. In Gephi terms, if a partition-quality check reports the attribute as not matching the topology, and you still want to see it, shape is the channel left.
Attributes drawn from observational data often fail question 2, because the same process that generates a category generates degree: institutions have more followers and are institutions, managers are hubs and are managers. Check the mean degree per category before committing the channel.
The case that needs no argument: greyscale and colourblind readers
Colour distinctions collapse in greyscale, and a great many figures are still printed that way. Shape survives.
Measured on a real published palette of seven categories, converted with the standard luminance weights, four had a near-twin:
| Pair | Distance out of 255 |
|---|---|
| closest | 1.7 |
| next | 5.1 |
| next | 5.8 |
| next | 11.5 |
Two categories 1.7 apart are the same grey. In the same image every shape remained readable. If a figure has to work in print, shape is not a nicety.
How categories become shapes
Categories are ordered by node count, largest first, and take shapes in this order:

| Order | Shape |
|---|---|
| 1 | Circle |
| 2 | Square |
| 3 | Triangle |
| 4 | Diamond |
| 5 | Star |
| 6 | Cross |
| 7 | Triangle, pointing down |
| 8 | Hexagon |
The order puts the most distinct outlines first. The first five are the ones gephi/gephi#1291 asked for. The cross comes next because nothing else has its silhouette. The downward triangle and the hexagon come last: one differs from an earlier shape only by orientation, and the other is the closest to a circle once nodes are small.
That is the same ordering rule the Appearance panel uses when it assigns colors to a partition, so coloring and shaping by the same column agree with each other: the largest category takes both the first color and the first shape. Ties in count are broken by the value itself, so the assignment does not move between runs.
Nodes with no value in the column are drawn as circles by the default renderer, with their color, size, border, and opacity untouched.
The column name is matched against column ids first and column titles second,
because the Data Laboratory shows titles and an import can leave the two
different: a GEXF attribute declared <attribute id="0" title="team"/>
produces a column titled "team" whose id is "0". A name matching neither leaves
the graph drawn as circles, and says so in the log.
Limits worth knowing
Five categories, not eight. The vocabulary holds eight, but readers stop telling outlines apart well before that, especially at small node sizes. Past eight, shapes repeat and two categories become indistinguishable. The plugin logs a warning in both cases. Group the small categories first.
Shape needs marks at roughly 3% of the layout extent. This is the practical ceiling, and it is a ratio, not a resolution. A network drawn with its largest node under 1% of the extent renders shape as coloured dots no matter how many pixels the export has. Measured on one network at two densities:
Full network Filtered Nodes 2,929 849 Layout extent 9,755 3,215 Largest node 75 105 Node as share of extent 0.8% 3.3% Smallest mark at export ~5 px ~23 px Shape readable no yes The fix is fewer nodes or a tighter layout, not a larger canvas.
Shapes match the circle's area, not its outline. Readers judge the size of a mark by its area, so a square and a circle of the same node size should look the same size. Shapes drawn inside the circle instead look smaller, from a third smaller for a square to a speck for a star, and node size stops meaning the same thing across categories. Shapes with corners are then trimmed a little, by at most a sixth of the area, because a triangle at full area looks heavier than the circle beside it. The cost is that a triangle's tip or a star's points reach slightly past the node's circle.
Corners are softened, and borders join round. Sharp vertices are where small marks look jagged, and where a thick border draws a spike past the node.
The column is named, not picked from a list. Preview properties are typed values rather than live column choosers, so the column name is typed in.
The legend
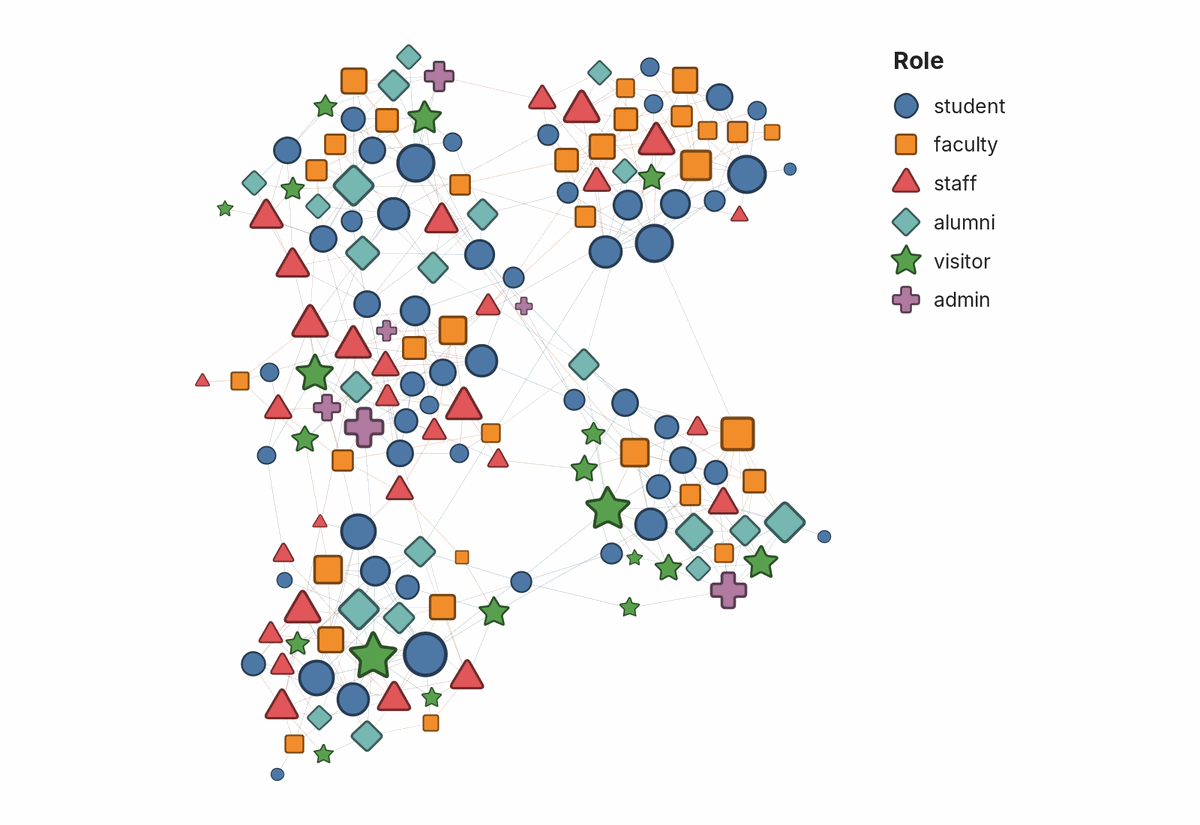
Gephi's exports carry no key, and tools that build one from Gephi's own colour and size mappings cannot see shapes, so the plugin draws its own. It is built from the same assignment the nodes are drawn with, so it cannot disagree with the map.
- Placement. Beside the graph, to the right and level with its top, so it never covers a node. Exports grow to make room for it.
- Order. Largest category first, the order the shapes were assigned in.
- Colour. When every category has one colour of its own, as when colour and shape encode the same column, the symbols take those colours and the key explains both. Otherwise the symbols are grey, so the key does not suggest a colour meaning that is not there.
- Colour section. With Colour legend column set, a second section below the shapes lists that column's groups with their colours, as circles, largest first. It is drawn only when the column explains the colours exactly: every group in one colour and no colour shared by two groups. Otherwise it stays off and the log says which group or colour broke the match. Gephi does not record which column the colours came from, and a detected community and the grouping it recovers can split the nodes identically, so the column is named rather than guessed.
- No value. Nodes without a value are drawn as circles, like the first category. The key lists them as "no value" so a reader can tell.
- Long partitions. After 16 rows the rest are counted ("+ 4 more"), not listed.
- Scale and type. Symbols are about as large as a typical node, within limits that keep them legible on a graph of tiny nodes. Text uses the node label font, and turns light on a dark background.
- SVG. The key is its own group,
<g id="shape-legend">, so it can be moved or restyled in a vector editor.
Output
The renderers draw to the on-screen preview and to the SVG, PDF, and PNG exports, legend included.
Building
From the repository root:
mvn -pl modules/ShapeByPartition clean package
Build with JDK 21, as the repository's CI does. The POM enables annotation
processing explicitly, because from JDK 23 javac no longer runs processors by
default and the @ServiceProvider registration would be silently left out of
the jar, producing a plugin that installs and never appears.
Licence
Apache License 2.0. See LICENSE.txt.