
Resources
Where can I find tutorials to learn how to use Gephi?
While we work on a dedicated page on the website, check these resources:
- Introduction to Network Analysis and Visualization by Martin Grandjean
- Gephi tutorials by Clément Levallois
Is there a YouTube video tutorials to learn Gephi?
Check out the following YouTube channels where you can find Gephi tutorials:
- Videos by Martin Grandjean
- Gephi’s YouTube channel
- Video tutorials by Mathieu Jacomy
Where can I find a dataset to practice with Gephi?
Check out this repository where you can find available datasets.
Is there a forum or community where I can get technical support for Gephi?
You have different options, by our order of preference:
- The Gephi Community room on Matrix
- r/Gephi on Reddit
- The Gephi Facebook group
Furthermore, you can browse the bugs list for similar issues, and submit a new bug report on GitHub
.  About Gephi
Should I use Gephi or Gephi Lite?
If you are a beginner, if you just want to take a quick look at Gephi, or if you can’t (or don’t want to) install an application on your computer, use Gephi Lite. It runs in any recent browser.
If you are comfortable with network analysis, or if you need to analyze large networks (more than 10,000 nodes), then install the desktop version of Gephi.
Is there an official Gephi course I can take to get certified?
There are currently no official Gephi courses available that offer certification.
I am going to publish my research where I used Gephi, how should I cite it?
Please cite this reference:
Bastian M., Heymann S., Jacomy M. (2009). Gephi: an open source software for exploring and manipulating networks. Proceedings of the International AAAI Conference on Web and Social Media, 3(1), 361-362.
Which operating systems does Gephi support?
How can I support Gephi?
Gephi is free software developed by a small community of volunteers. You can contribute to its development or make a donation.
Why is Gephi called “Gephi”?
It comes from French. “Ge-” refers to the letter G (pronounced “jay” or “gé” in French) which stands for “graphs”, and “-phi” refers to the Greek letter (ϕ) which stands for “filters”. It alludes to the initial intent to provide interactive graphs along with filters. That is why the logo is a G intertwined with a ϕ.
How do I pronounce “Gephi”?
With a hard G as in "girl"; at least in English. The French pronounce it with a soft G as in "joke" (as always before the letter E). The English-speaking community discovered Gephi through mostly written documentation, not knowing its French authors would pronounce it with a soft G. The hard G pronunciation became dominant for no particular reason.
Technical
General
In which format should I import my files into Gephi?
Gephi can import a variety of standard graph file formats. These include GEXF, GDF, GML, GraphML, Pajek NET, GraphViz DOT, CSV, UCINET DL, Tulip TPL, Netdraw VNA, and Spreadsheet formats.
Note that there are two different ways to import CSV files: from the “import” menu if it contains nodes and edges at the same time (and no attributes); and from the Data Laboratory as two CSV, one for the node, and one for the edges (both with attributes). You can read more about this topic in this blog post.
How do I create dynamic networks?
To create dynamic networks, check out these links:
Is there a button or function to undo an action?
Currently, this feature isn’t available.
This is the most requested feature. It’s not implemented yet because it is genuinely hard to do, not because we don’t think it is useful. We know that it would be great to have, and it is on our road map.
Data Laboratory
I uploaded my file to Gephi, but I can't find some of the original columns from my file in the Data Laboratory.
Go to the Data Laboratory, locate the eye-shaped icon in the upper right area (on older versions, a light bulb) and click on it. A list of the column names from your file will appear.
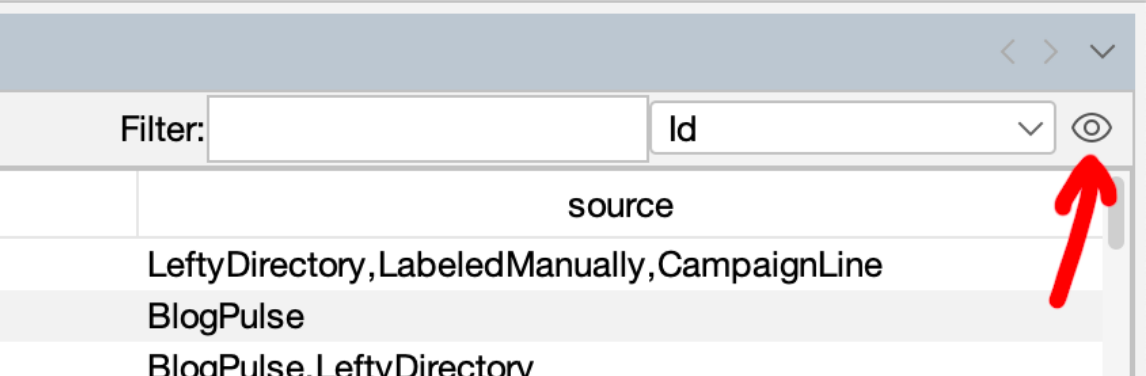
You will see that some are active and others are not. In this window, you can activate the columns you want to display in your data laboratory. You can also deactivate those that are not necessary to make exploring your columns easier. You cannot display too many columns at the same time.
How do I import my data from a spreadsheet into Gephi?
To import data from a spreadsheet into Gephi, check out this tutorial.
Where is the “Degree” column?
The node degree (i.e., the number of edges) is calculated dynamically, and is not like the other attributes. It is not written in the data, and therefore is not displayed in the Data Laboratory.
Why are there two “Degree” attributes? And why do I see only one in the Data Laboratory?
Although the degree is computed dynamically by Gephi and appears in various places like the Appearance panel, you can compute it once and for all from the Statistics panel. This will create a new node attribute.
The new attribute will appear as a column in the Data Laboratory, while the dynamically computed degree will not.
In the Appearance panel and a few other places, both the dynamically computed degree and the node attribute will appear, and they are named the same.
If you remove an edge or change the network in other ways, the dynamic degree will adjust accordingly, but not the node attribute. There is a risk of making mistakes, but you can take advantage of it in various situations.
Overview
How to use the filters? Are there tutorials?
Check out the following links:
My graph disappeared! How do I get it back?
You probably closed the “Graph” panel by accident. In the “Windows” top menu, select “Reset Windows” to return to the default panel configuration.
My nodes’ labels don’t reflect the column I want to display. How can I change it?
Once you have opened your network in the Overview tab, go to the lower section and expand all the settings by clicking the small arrow on the right-hand side.
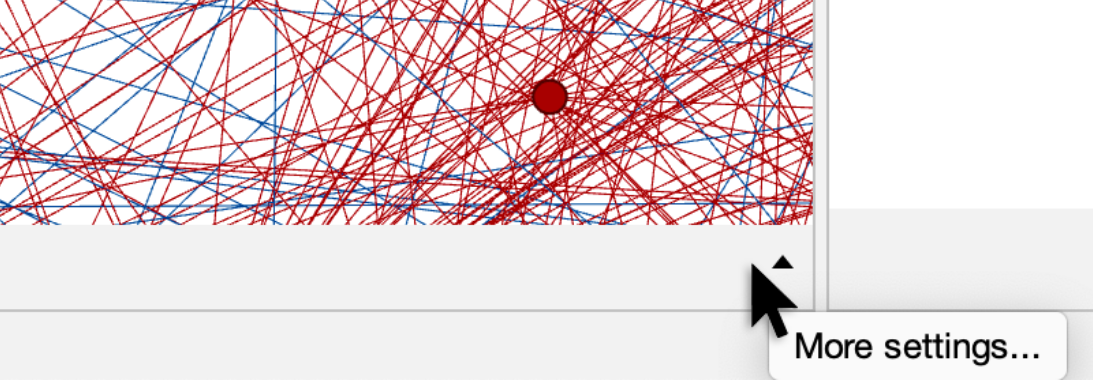
You will see three tabs: Global, Edges, and Labels. Activate the last one (Labels) and click on the Configure... option. A window will appear where you should select the Nodes tab. Finally, choose the attribute you want to display as a label on the nodes.
In the Statistics section, I can’t find the option to run the Betweenness Centrality metric!
To run the Betweenness Centrality measure in Gephi, click on the Network Diameter option, where you will be able to run Betweenness Centrality and other centrality measures.
Why are some communities in my network not getting colored when I apply the Modularity Class in the Appearance section?
Because only the top 8 categories get a color by default, while the others get painted gray. But you can change that setting.
Once you have applied Nodes > Partition > Modularity Class, click on the Palette… option. A window will appear. Deselect the Limit number of colors option (which is set to 8 by default), then click Generate > OK. This will color all the communities in your network.
The rationale behind that design choice is that the human eye cannot efficiently discriminate that many colors; but it is sometimes useful to break that rule.
I have located a node of interest in the Overview section. How can I find it in the Data Laboratory?
In the Overview section, right-click on the node of interest and choose Select in Data Laboratory. Then, in the Data Laboratory, the corresponding row will be highlighted.
Why aren't the panels/windows displayed as in the tutorials?
Gephi's interface lets you move, resize, open or close the small windows containing the various tools. You may have closed one by mistake. In the “Windows” top menu, select “Reset Windows” to return to the default configuration.
How can I keep the values I have obtained from a first calculation (e.g. metrics or modularity) if I want to run a new calculation following a modification/filter, etc.?
If you run a calculation twice, for example for degree of centrality, the new values will replace the previous ones in the relevant column. Before launching the new calculation, you should therefore duplicate the column in the Data Laboratory and give it a new name (e.g. “Degree v1”) so that Gephi doesn't overwrite these values.
Preview
Why aren’t the labels of my network displayed in the Preview section?
To display the labels of your nodes in the Preview section, click on Preview Settings, then go to the Node Labels section and activate the Show Labels option. Finally, click the Refresh button.
In the Preview section, the node labels appear below the nodes. How can I move them so they are displayed above the nodes?
To make the labels appear above the nodes, go to the Preview section and click on the Preview Settings tab. Then select the Manage Renderings tab, locate the Default Node Labels option, and use the upward arrow to move it to the top position. This will ensure that the node labels are displayed above the nodes.
How can I improve the resolution of my network when I download it in PNG format?
When you click on the Export SVG/PDF/PNG option, a window will appear to save your network in PNG format. Assign a name to your file, but before clicking Save, click on Options… (a button located in the same window). Here, you can increase the image resolution by adjusting the pixel values, which will improve the quality of your image.
I want to be able to edit my network after export. What format should I use?
SVG is a vector-based (non-pixelated) format that lets you modify all the objects in the image created by Gephi. It can be opened in a browser, but more importantly, it can be modified with vector graphics software such as Adobe Illustrator or Inkscape (free and open-source). This allows you, for example, to add a caption, highlight nodes or add a background map behind your geo-spatialized network.
Why is my network in the Preview showing large colored areas behind the nodes?
This can happen if the size of the edges is set incorrectly and their arrows appear gigantic. In “Edges”, change the “Thickness” or select “Rescale weight”. If you don't want to touch the edges, you can also simply change the size of the arrows themselves (down to 0 to remove them completely) in “Edge Arrows”.