
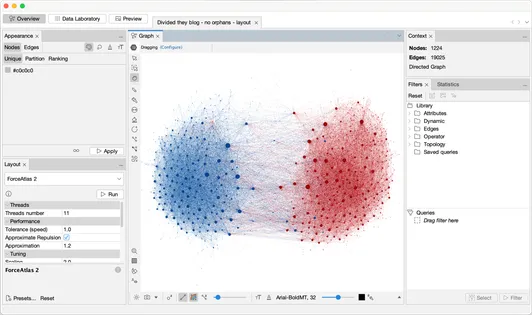
Gephi Desktop
Since 2008, Gephi has empowered researchers, journalists and students across diverse fields to explore, manipulate, and understand complex networks.
The Gephi application in Java ("Gephi Desktop") is open-source and free under the GPL License.
Visual thinking
Like GIMP but for graph data, the user interacts with the representation, manipulate the structures, shapes and colors to reveal hidden patterns.
Gephi helps data analysts explore networks, test hypotheses, and discover meaningful patterns in complex relational data. By enabling visual thinking through interactive interfaces, it complements traditional statistical methods and enhances analytical reasoning.
Built for Exploratory Data Analysis, Gephi embodies principles from the Visual Analytics research field.
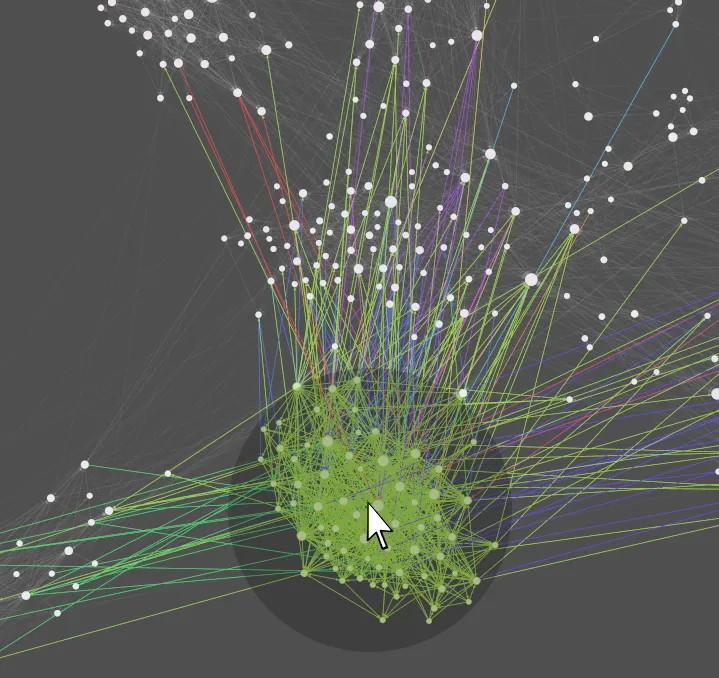
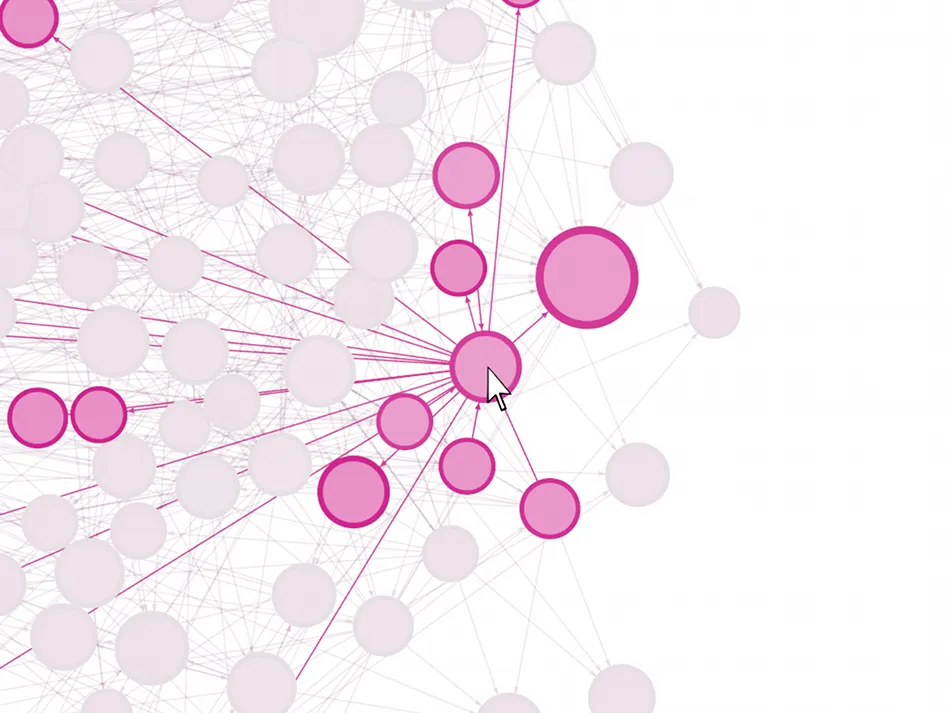
Real-time visualization
Experience the fastest graph visualization engine to accelerate understanding and pattern discovery in large networks.
Powered by a custom OpenGL engine, Gephi delivers unmatched performance for interactive network exploration.
- Handle networks with up to 100,000 nodes and 1,000,000 edges
- Refine insights with dynamic filtering capabilities
- Transform data using comprehensive graph manipulation tools
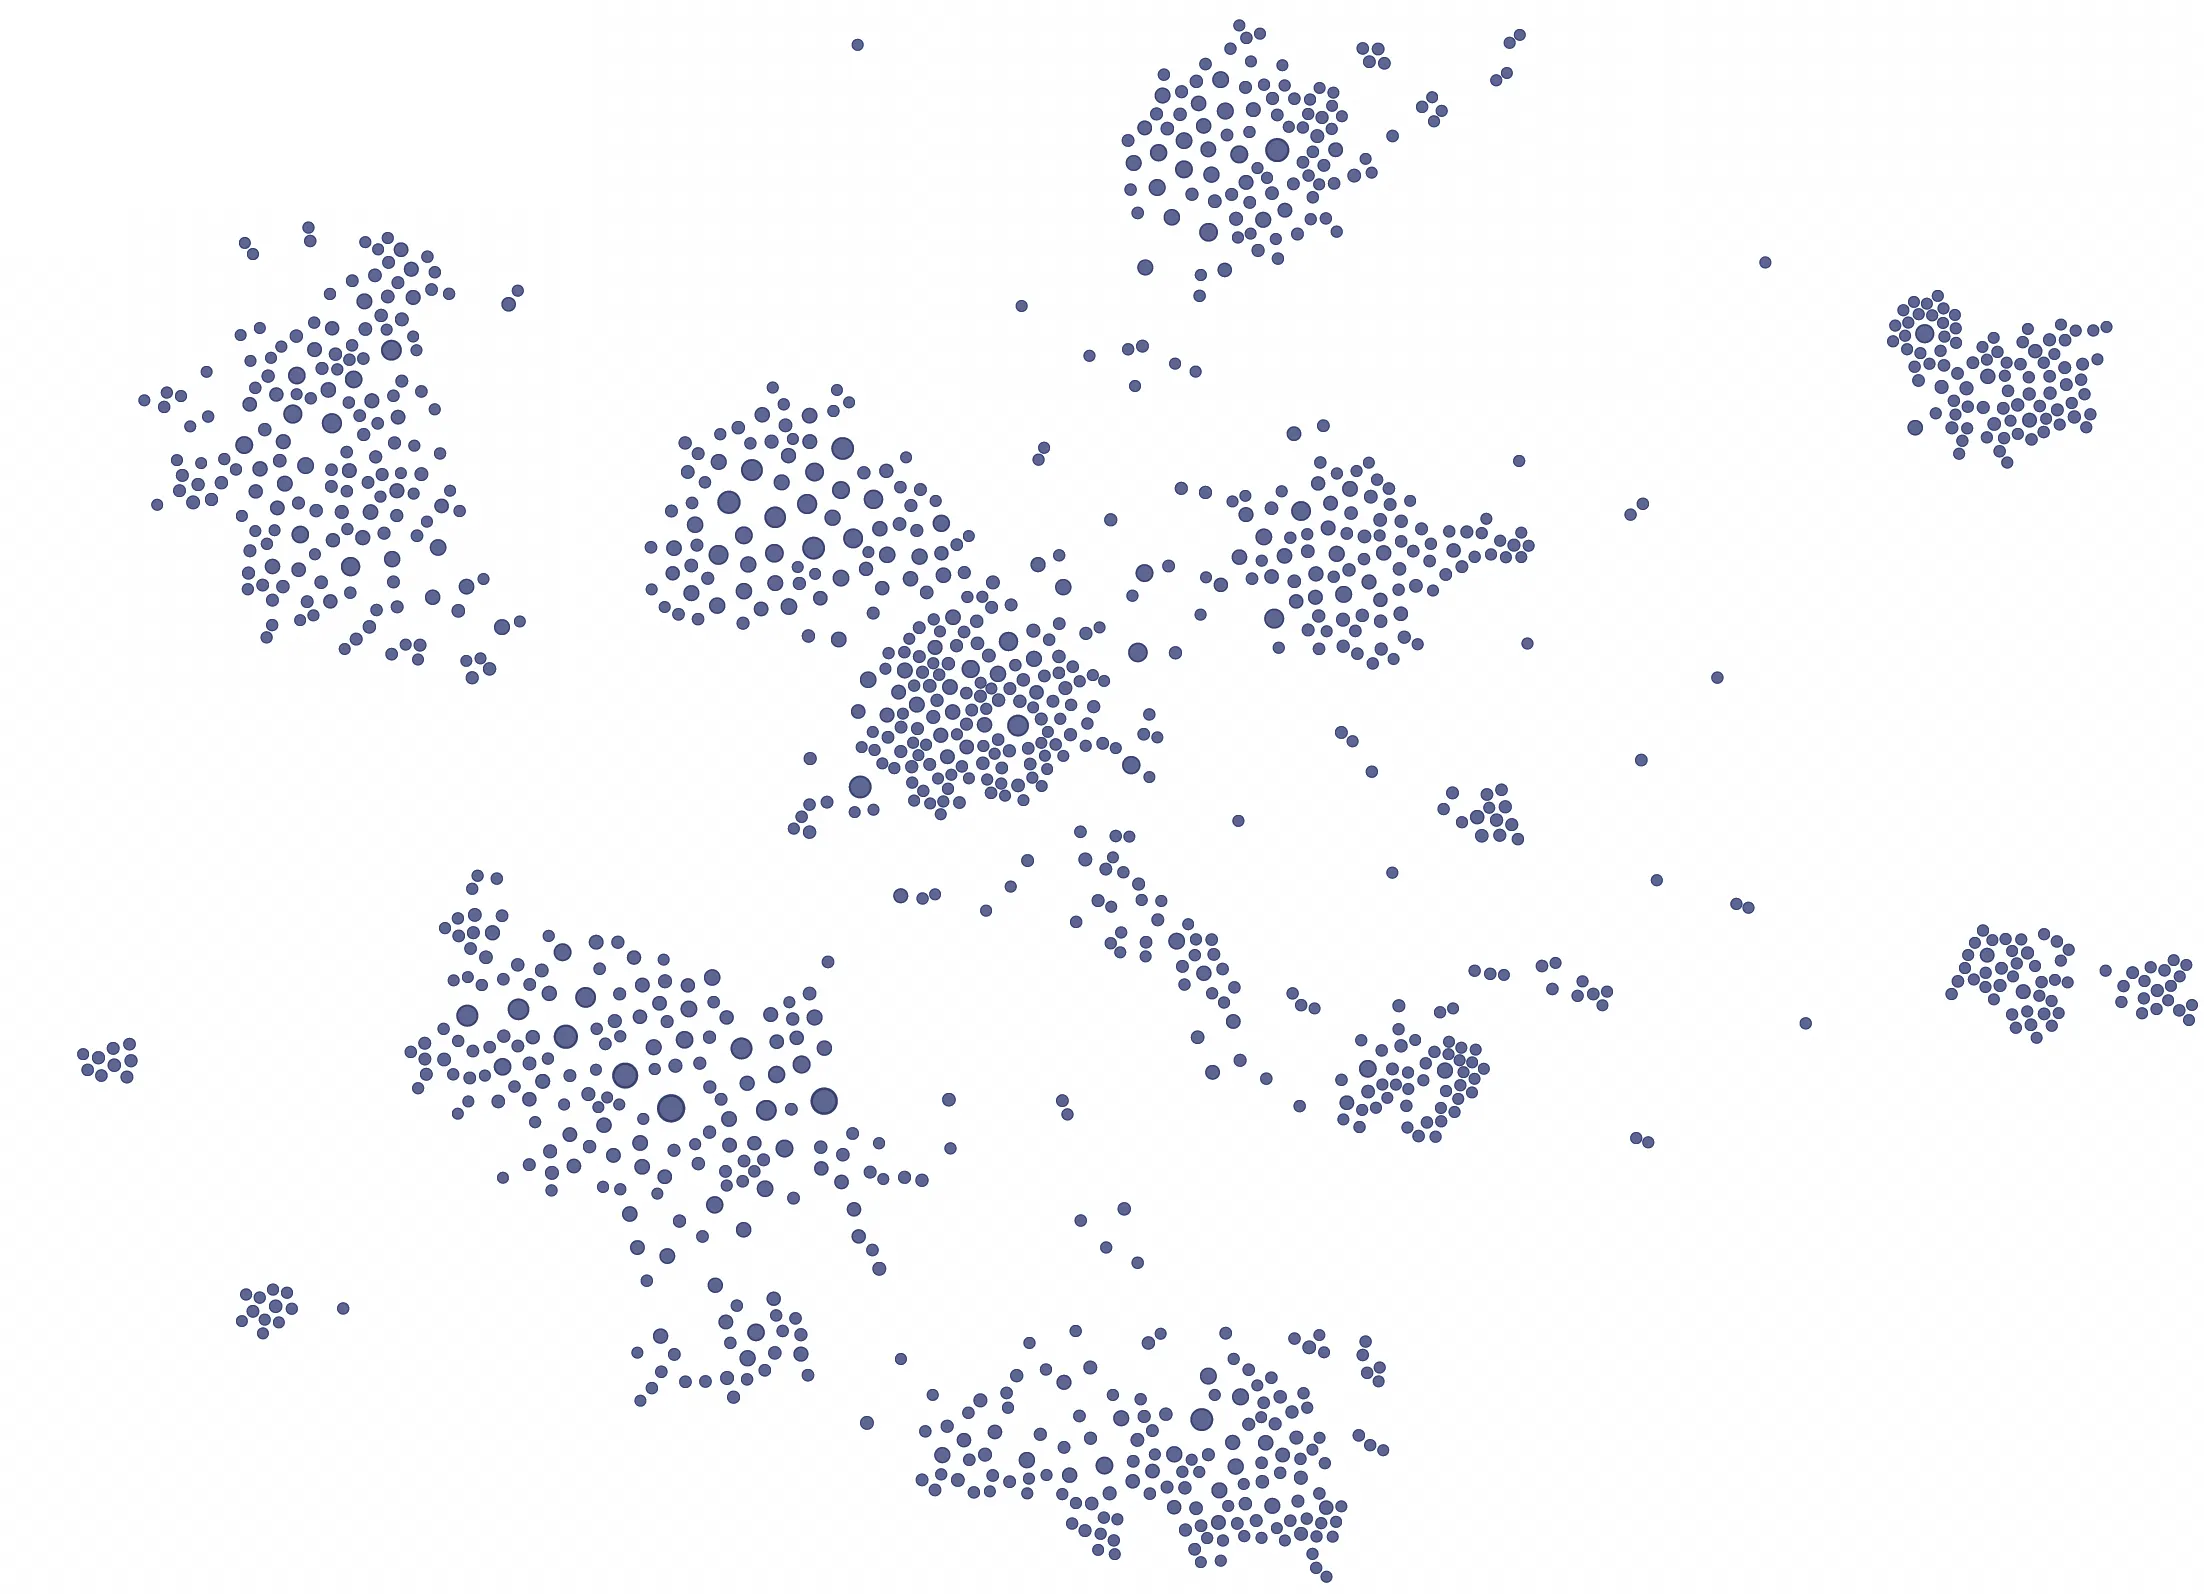
Layout
Layout algorithms define the visual structure of your graph. Gephi offers state-of-the-art network layout algorithms that balance both efficiency and quality.
The Layout module enables real-time adjustment of layout settings, dramatically enhancing user feedback and experience.
- Force-driven algorithms for natural node positioning
- Readability optimization for clearer graph interpretation
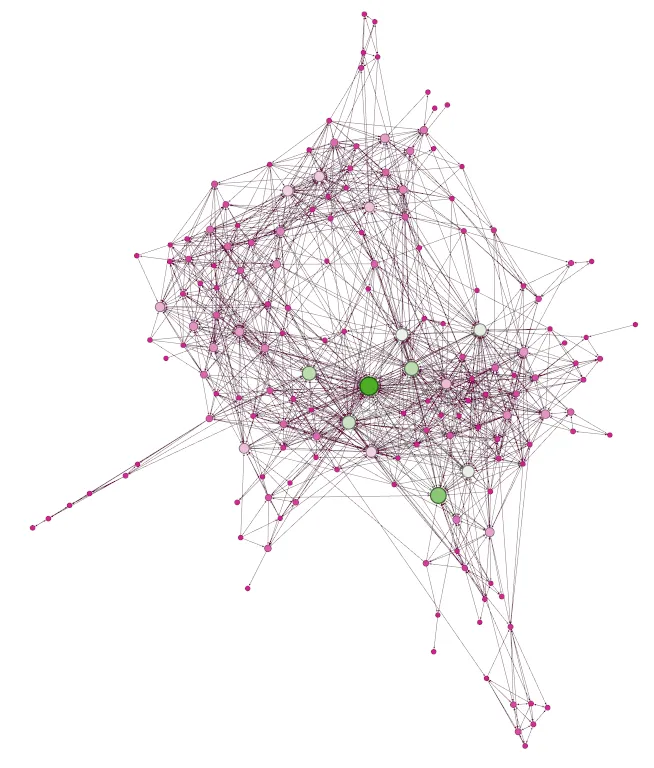
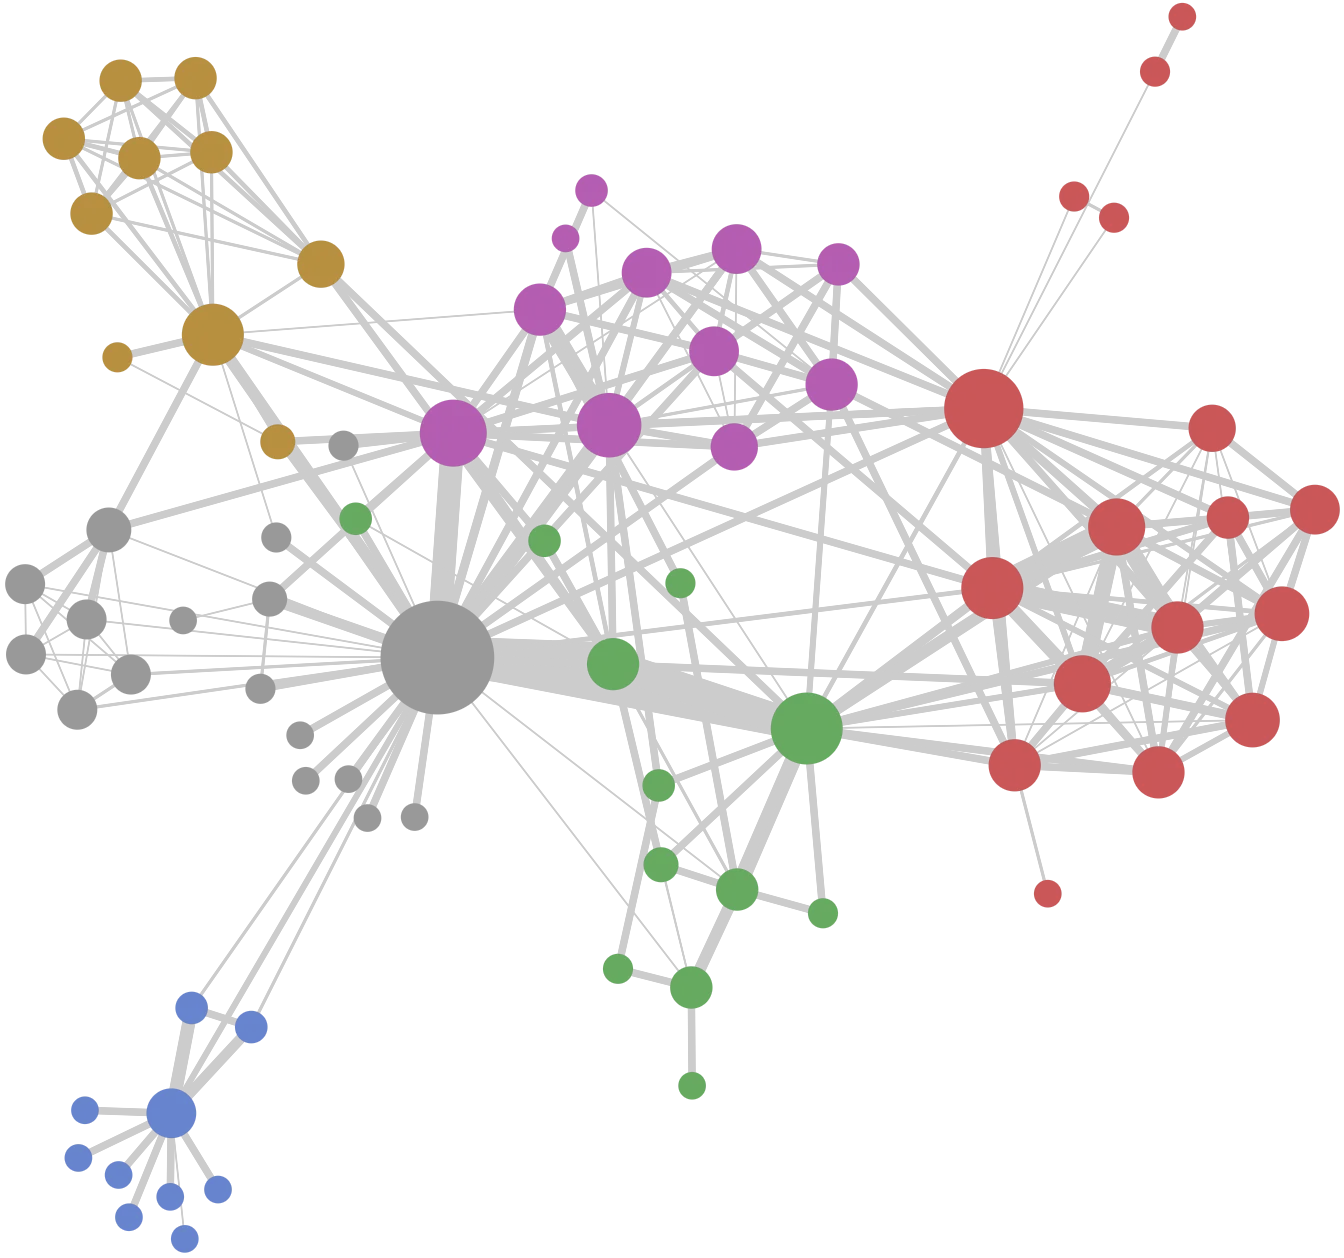
Metrics
The statistics and metrics framework offer the most common metrics for social network analysis (SNA) and scale-free networks.
- Betweenness Centrality, Closeness, Diameter, Clustering Coefficient, PageRank
- Community detection (Modularity)
- Random generators
- Shortest path
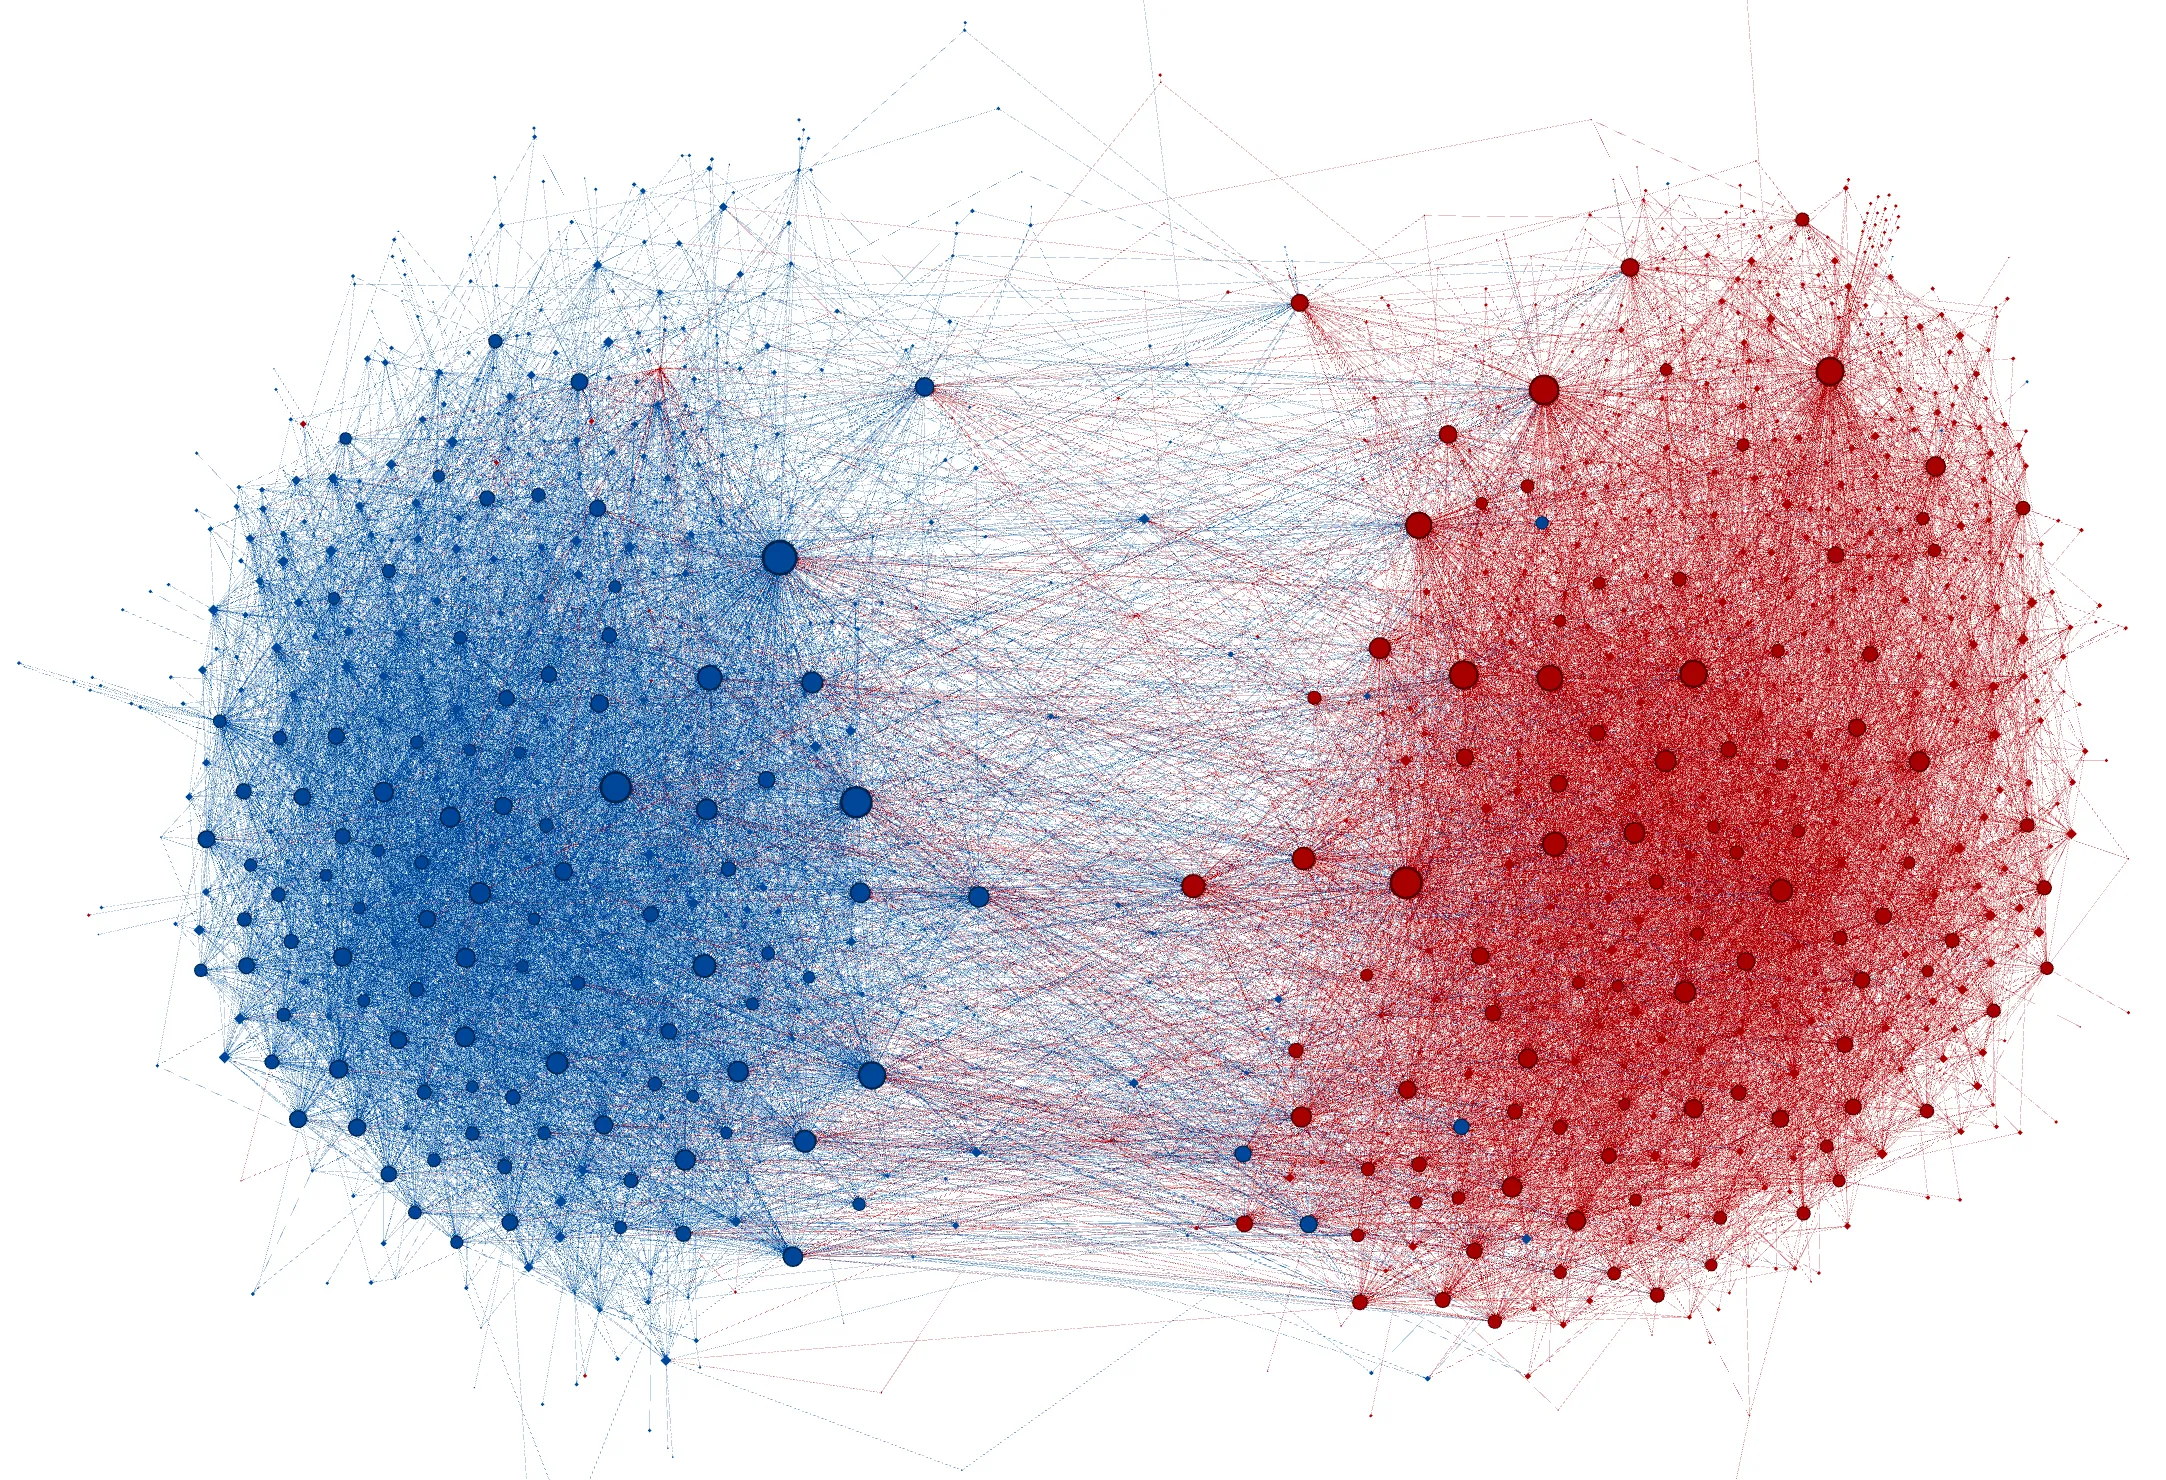
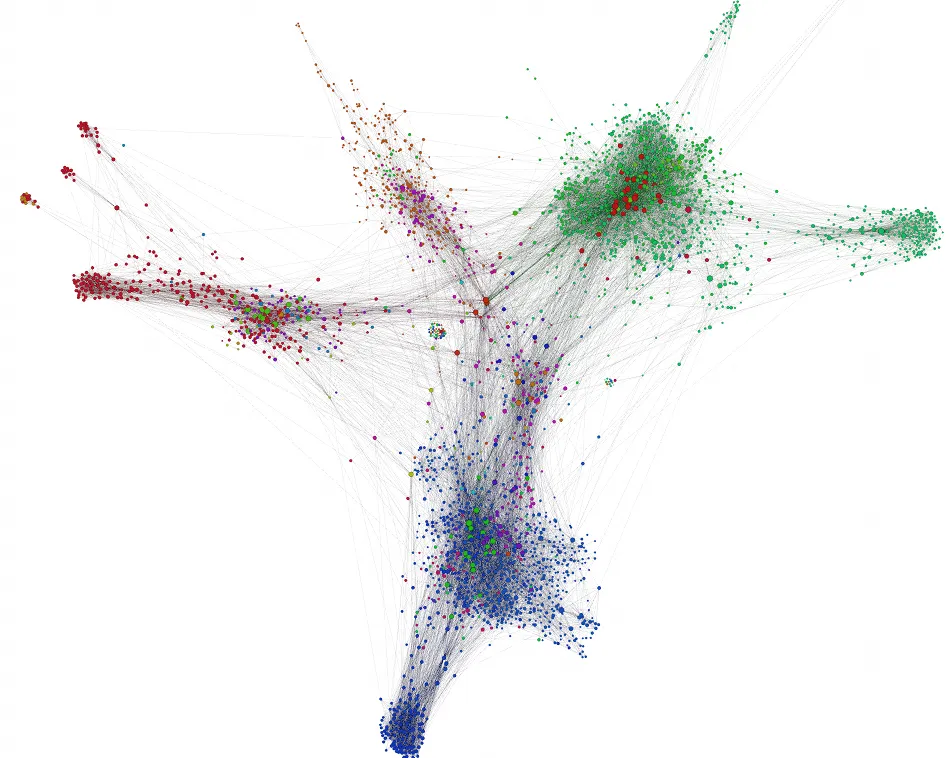
Make Cartography
Use ranking or partition data to make meaningful the network representation. Customize colors, size or labels to bring sense to the network representation.
The vectorial based preview rendering lets you put the final touch and care about aesthetics before explorting in SVG, PNG or PDF.
- Customizable export parameters
- Save presets
Data Table and Edition
Gephi has its own Data Laboratory to manipulate data columns, search and transform the data.
- Powerful Search/Replace
- Manipulate columns
- Batch-edit, custom column merge and more
Dynamic Filtering
Filter the network to select nodes and/or edges based on the network structure ordata .
Use interactive user interface to filter the network in real-time.
Input / Output
Gephi can read the majority of graph file formats but also supports CSV and databases import.
- Spreadsheet import wizard
- Database import
- Save/Load project files
Extensible
The built-in Plugins Center automatically gets the list of plugins available from the Gephi Plugin portal and takes care of all software updates.
There are various community-built plugins that extends Gephi's functionalities.
Roadmap
Gephi Desktop has been a “beta” version for more than a decade. This just means that the team does not consider the tool to be complete yet. We aim to implement the following features before getting “version 1.0”:
- Undo feature, limited to the “GEXF scope”: network data, metadata, positions, sizes, colors…
- More readable UI with clearer icons.
- Activity log, possibly coordinated to undo, possibly stored in the GEXF.
- Parallel edges. The GraphStore (Gephi’s internal engine) supports them but they are not currently visualized or accessible from the user interface.
- Improved timeline for dynamic graphs.
- New GPU visualization engine. We aim for comfortably visualizing 200K nodes and 1M edges on an average consumer laptop. Might be ready soon!
- Legend generator (note: available in Gephi Lite)
We are also considering the following features, but for a more distant future:
- Local exploration, i.e. at least a quick overview of a subgraph.
- Integrate other visualization (treemap, scatter plots...)
- Rework the image export with more advanced renderers