Description:
Author:
Sources:
github.com/johanm/gephi-plugins.gitLicense:
Compatible Gephi versions:
Tools > Pluginsmenu. The following download links may be useful to spread this plugin to people with no internet access, for instance.
README:
Community Clusters
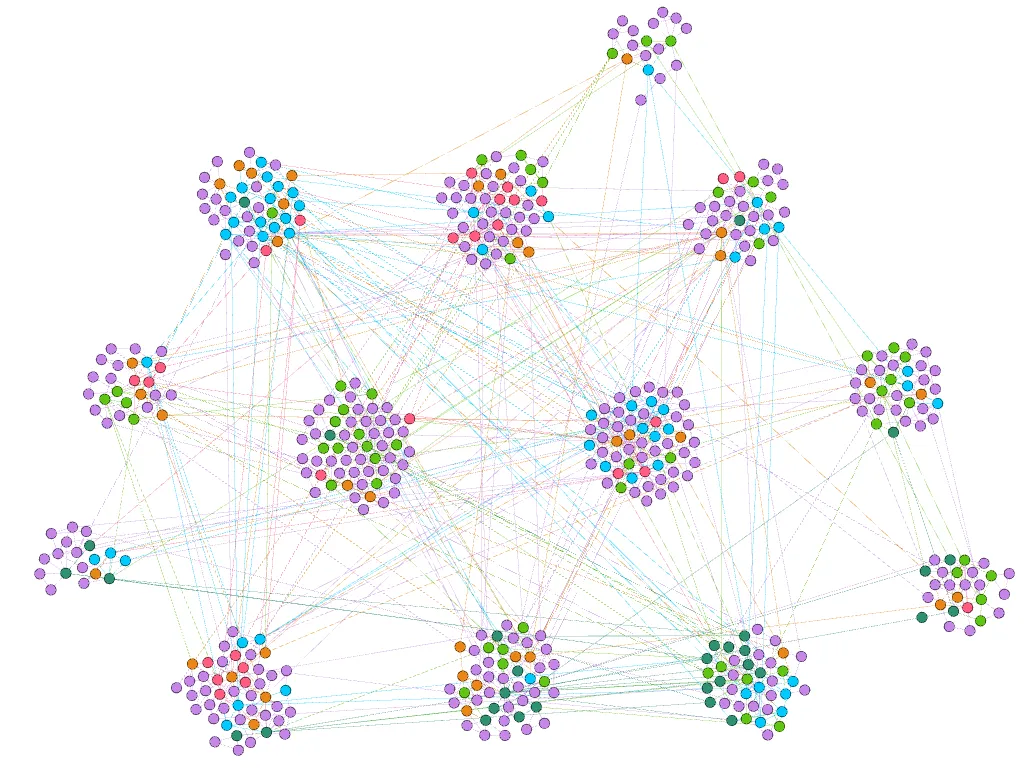
Community Clusters is a layout for Gephi. It arranges a network so that each community forms its own visible cluster, with the clusters themselves placed apart from each other. Inside a cluster, nodes are arranged by their ties, so well-connected nodes sit together and weakly connected ones drift to the edge.
Any categorical node field can be used as the Cluster column, whether its categories are numbers or text: a community number, a department name, a country, a type. Or let the plugin detect the communities itself. It is built for Gephi 0.11.4.
1. Quick start
Using communities you already have
- Open your graph in Gephi.
- Run Statistics > Modularity (Run). This creates the node column
modularity_class. - Open Window > Layout and choose Community Clusters in the dropdown.
- Press Run. The layout stops by itself when it has settled.
Letting the plugin find the communities
- Open your graph.
- In the layout settings, open the Cluster column list and choose (none: detect communities with Leiden).
- Press Run. The plugin detects communities with the Leiden algorithm and, by default, saves
them to a node column called
community_clusterso you can colour nodes by it (Appearance > Nodes > Partition >community_cluster).
2. How it works
- Find the communities. Each node gets a cluster, either from the column you choose or from Leiden.
- Give each cluster a home. One circle is drawn per cluster, with an area that grows with the number of nodes in it, and the circles are packed together without overlapping, largest first. The centre of each circle is that cluster's home position.
- Simulate. Nodes start close to their cluster's home and a force simulation runs:
- Ties pull connected nodes towards their resting length. Ties inside a cluster act at full strength; ties between clusters are weakened (see Inter-cluster tie factor), so they do not drag clusters into each other.
- Repulsion pushes nearby nodes apart. It only acts within a fixed distance of 140 units (multiplied by Scale), so distant clusters do not push each other around.
- Collision stops nodes from overlapping.
- Cluster pull draws every node towards its cluster's home.
- Cool down. The forces fade out over time. When they are negligible the layout stops itself.
The layout works on the visible graph, so active filters are respected. Nodes you have fixed (locked) in Gephi do not move, but other nodes still react to them.
3. Settings
The settings are grouped in three categories in the layout panel. Defaults are shown in brackets.
3.1 Clusters
Cluster column (default: modularity_class)
The node column that says which community (category) each node belongs to. Nodes with the same value
form one cluster. The setting is a drop-down list that shows the categorical node columns of your
graph: columns holding whole numbers, text, or true/false values. Columns with decimal numbers, lists
or time-dependent values, and the built-in Id and Label columns (different for every node), are not
shown.
- A column is chosen: its values are used as they are. No community detection is run.
- (none: detect communities with Leiden): the plugin finds the communities itself (see Resolution and Save clusters to column).
- Nodes with an empty value in the column are grouped together as one cluster.
- The list shows the categorical node columns of the current project.
- If a project was saved with a column that no longer exists, the layout falls back to Leiden and writes a note to the Gephi log.
Tip: modularity_class is the column created by Gephi's own Modularity statistic, so the default
uses its result whenever you have run it. If you have run Modularity but want the plugin's Leiden
instead, choose (none: detect communities with Leiden).
Resolution (default: 1.0, minimum 0.01)
Only used when Leiden runs. Controls how fine-grained the detected communities are.
| Value | Effect |
|---|---|
| Below 1 | Fewer, larger communities |
| 1 | Standard modularity |
| Above 1 | More, smaller communities |
If the clusters are too coarse and merge groups you see as distinct, raise it (try 1.5 or 2). If you get many small fragments, lower it (try 0.5).
Save clusters to column (default: on)
Only used when Leiden runs. When on, the detected community of each node is written to an integer node column
named community_cluster. It is overwritten each time Leiden runs. You can then:
- colour nodes by it (Appearance > Nodes > Partition),
- use it in the Data Laboratory or in filters,
- choose
community_clusterin Cluster column to reuse exactly this result later without running detection again. This is also a way to freeze a result so it does not change.
Turn it off if you do not want an extra column in your data.
Cluster pull (default: 0.1, minimum 0)
How strongly each node is drawn towards its cluster's home position. This is the main control for how separated the clusters look.
| Value | Effect |
|---|---|
| 0 | No home position; ties and repulsion alone decide, and clusters may blend |
| 0.05 | Loose clusters, ties between clusters still have visible influence |
| 0.1 | Default; clear clusters |
| 0.2 – 0.6 | Tight, round, well separated blobs |
Very high values can squeeze nodes into dense balls where collisions have to push them apart.
Inter-cluster tie factor (default: 0.03, minimum 0)
How strong ties between clusters are compared to ties inside a cluster. At 0.03 a tie between two clusters pulls only 3 % as hard as a tie within one.
- Lower (towards 0): clusters ignore each other's ties, so the layout shows clusters as separate islands.
- Higher (towards 1): between-cluster ties draw related clusters closer together, so the overall structure of the network is easier to read, at the price of less clean separation. At 1 the cluster ties are treated like all others.
3.2 Forces
Repulsion (default: 40, minimum 0)
How hard nodes push each other apart. Higher values spread nodes out within their clusters and give larger clusters; lower values pack them densely. Repulsion only acts within 140 units (times Scale).
Tie length (default: 24, minimum 0)
The resting length of a tie, added to the sizes of the two nodes it connects. Longer ties give a more open layout. It works together with Repulsion: if you raise one, you often want to raise the other.
Tie strength (default: 1, minimum 0.01)
Multiplies how hard ties pull their ends together. Internally each tie's strength is divided by the smaller of its two nodes' number of ties, so hubs are not pulled apart, and capped at 1. The result: increasing this setting mostly affects nodes with few ties, and above a certain point it has no additional effect. Lower values loosen the layout, with Repulsion dominating.
Node spacing (default: 2, minimum 0)
Extra room kept around each node by the collision force, in addition to the node's own size. Raise it to keep node labels or outlines from touching; set it to 0 to let nodes touch.
Scale (default: 1, minimum 0.01)
Multiplies all distances in the layout together (tie length, spacing, repulsion range, size of the cluster circles and the 140-unit repulsion range), and keeps forces in proportion. The plugin treats Gephi's node size as the node radius.
- If your nodes are large (for example sizes 50 to 200), nodes will overlap and clusters will be crowded. Raise Scale until the layout looks right.
- If your nodes are very small, lower it.
3.3 Run
Settling speed (default: 0.03, range 0.0005 – 0.5)
How quickly the simulation cools down. It decides how long the layout runs before it stops by itself.
| Value | Approx. number of steps |
|---|---|
| 0.1 | 65 |
| 0.03 | 230 |
| 0.02 | 340 |
| 0.01 | 690 |
| 0.005 | 1,380 |
Lower values take longer but usually give a more even, better untangled result. Higher values are quick for a first look at a large graph.
Random seed (default: 4711)
Seeds the random starting positions and the Leiden algorithm. With the same graph, same settings and same seed you get the same result every time. Change it to get a different arrangement, which is useful if you want to see whether a feature of the layout is stable.
Reset positions (default: on)
- On: every run starts from fresh positions around each cluster's home.
- Off: the run starts from the current positions of the nodes. Use it to continue a layout that has already been run, or to refine it with different settings without starting over. If all nodes are at the same position, leave it on.
Fixed nodes always keep their current position.
4. Recommended workflows
Presenting known communities. Run Modularity (or use your own column), choose Community Clusters, leave the defaults. Raise Cluster pull to 0.3 for cleaner separation.
Exploring how clusters relate. Raise Inter-cluster tie factor to 0.2 – 0.5, lower Cluster pull to 0.08. Clusters with many ties between them will move closer.
Tuning the number of communities. Choose (none: detect communities with Leiden) in Cluster column,
run, and adjust Resolution until the number of clusters suits your question. When satisfied, choose
community_cluster in Cluster column to lock that partition.
Polishing. After a first run, lower Settling speed to 0.008 and run again with Reset positions off. Then run Gephi's Noverlap or Label Adjust if you need to clean up labels.
5. Notes and limits
- Isolated nodes (nodes without ties) cannot be assigned to a community by Leiden, so each one becomes its own one-node cluster and gets its own place in the packing. A graph with many isolated nodes will therefore show many tiny circles. Remove them with a filter (Degree Range) before running if this is not wanted.
- Directed graphs are treated as undirected. Parallel edges and edges in both directions are added together, and edge weights are used. Self-loops and edges with zero or negative weight are ignored.
- Leiden quality is measured with modularity. Like all modularity methods it can miss very small communities in very large graphs. Raise Resolution if that matters. Leiden repeats its passes over the graph until the result no longer changes, with at most four passes.
- Speed. A run takes about 230 steps. On a graph with 20,000 nodes and 80,000 ties a complete run takes roughly 3 to 8 seconds on a single processor core (less on a multi-core computer), whichever column you choose. Leiden adds a few seconds for 50,000 nodes and 250,000 ties. Very large graphs (100,000 nodes and more) take correspondingly longer: raise Settling speed for a quick first look. Repulsion between nodes uses a Barnes-Hut approximation (as in d3-force), so big, crowded clusters stay fast, and it uses all processor cores.
- Stopping. Press Stop in the layout panel at any time: the positions reached so far are kept.
- Gephi's own Modularity column (
modularity_class) is produced by a different implementation (Louvain) than the Leiden used here, so the two can give somewhat different communities for the same graph.
6. Troubleshooting
| Problem | What to try |
|---|---|
| The layout is not in the dropdown | Open a project first; check the plugin is listed in the root pom.xml and the build succeeded |
| Everything ends up as one cluster | The chosen column has the same value for every node. Choose another column, or choose (none: detect communities with Leiden) |
| The Cluster column list does not show my column | Only whole-number, text and true/false columns are listed. Decimal-number columns are not categories: convert them (for example round to whole numbers or bin them) in the Data Laboratory |
| The layout takes very long | Very large graph: raise Settling speed (for example 0.1) for a fast first result, then refine with Reset positions off |
| Far too many clusters | Lower Resolution; check for isolated nodes (see above) |
| Clusters overlap each other | Raise Cluster pull; lower Inter-cluster tie factor; if nodes are large, raise Scale |
| Nodes overlap inside clusters | Raise Node spacing or Scale; raise Repulsion |
| Clusters look like perfect circles with no structure | Lower Cluster pull and raise Tie strength so ties shape the inside |
| The layout never seems to stop | Lower values of Settling speed run longer; raise it to finish sooner |
| The layout stops immediately | The graph is empty, or the previous run is finished: press Run again |
| A note about a column in the Gephi log | The column stored with a saved project no longer exists, so Leiden was used |
7. Credits
The layout is inspired by Fierăscu, S. I. (2026). SoFab: Network analysis for research and practice (Version 0.9.5) [Computer software]. Available at https://sofab.silviafierascu.eu/.
8. Version history
- 1.0.0: The Cluster column setting is now a drop-down list of the categorical node columns (it was a text field). Much faster on larger graphs with big clusters (repulsion uses a Barnes-Hut approximation and several processor cores; before, a 20,000-node graph with a few big clusters could take minutes). The graph is locked for much shorter times during a run. Leiden stops after at most four passes. New, rounder default values: Cluster pull 0.1 (was 0.14), Settling speed 0.03 (was 0.0228, about 230 steps instead of 300, same result), Random seed 4711 (was 42).
- 0.1.0: First release.
9. For developers
Source code: https://github.com/gephi/gephi-plugins/tree/master-forge/modules/CommunityClusters. Licensed
under Apache 2.0 (see LICENSE).
cd /d C:\gephidev\gephi-plugins
mvn clean package
mvn org.gephi:gephi-maven-plugin:run
| File | Role |
|---|---|
CommunityClusters.java |
The Gephi layout: properties, reading the graph, writing positions |
CommunityClustersBuilder.java |
Registers the layout with Gephi |
ClusterColumnEditor.java, ClusterColumns.java |
The drop-down for the Cluster column setting and its rules |
ClusterForceSimulation.java |
The force simulation (pure Java) |
RepulsionTree.java |
Barnes-Hut tree for the repulsion between nodes |
CirclePacker.java |
Packs one circle per cluster to give each a home position |
Leiden.java |
Community detection (pure Java) |
Bundle.properties |
All user-visible text (setting names, descriptions, layout name) and the long description shown in Gephi's plugin manager |
src/test/java/... |
JUnit tests |