

Description:
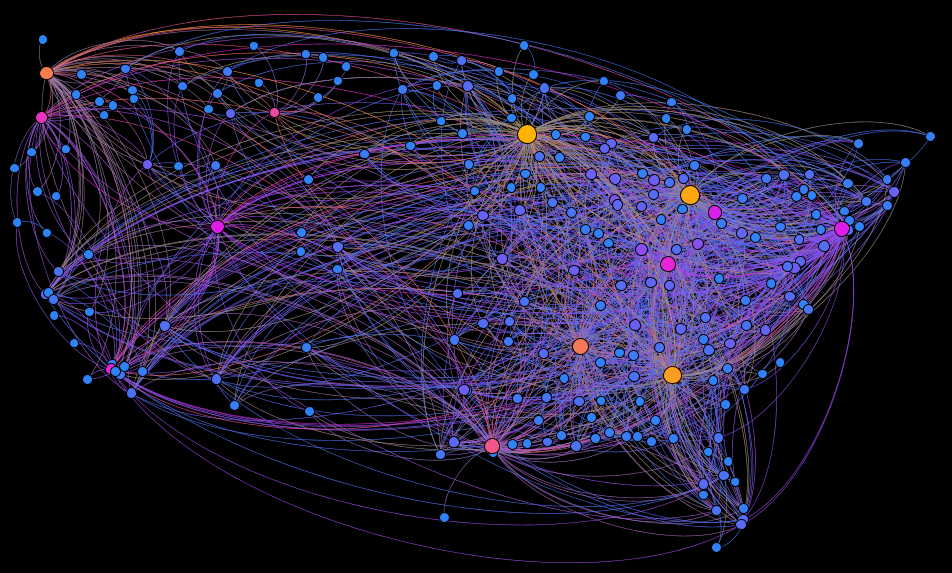
This plugin contains the "GeoLayout", which displays your graph based on geocoded attributes (i.e. latitude and longitude) and standard projections.
Author:
- Alexis Jacomy
Sources:
github.com/gephi/gephi-plugins/tree/geolayout-pluginLicense:
GPL v3
Compatible Gephi versions:
When possible, you should directly install this plugin from Gephi
Tools > Pluginsmenu. The following download links may be useful to spread this plugin to people with no internet access, for instance.
Related images:
README:
Introduction
A Gephi plugin to display your geocoded graphs.
Plugin Owner’s Notes
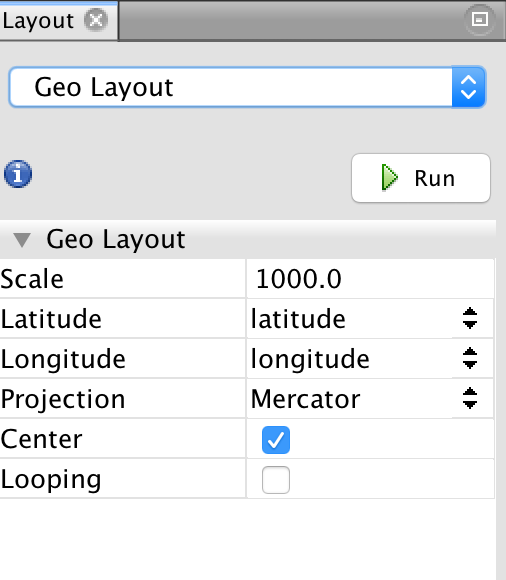
This plugin contains only a layout (“GeoLayout”) to display your graph according to geocoded attributes. To use it:
- Select the two attributes which contain the geocoded coordinates of your nodes (latitude and longitude). The attributes must have a numeric type.
- Select the projection you want to use
- Set the other parameters according to the selected projection
- Launch the algorithm
The available projections are:
- Mercator
- Tranverse Mercator
- Miller cylindrical
- Gall-Peters
- Sinusoidal
- Lambert cylindrical
- Winkel Tripel
- Equirectangular
And if, for any reason, some of your nodes do not have valid values on the selected attributes (for latitude and longitude), they will be displayed on a line on the bottom of your graph (then, you can delete them or do what you want). Also make sure your latitude and longitude columns are of a numeric type, not 'string'.